Google launched a new business intelligence tool called Data Studio in May 2016. It’s a really smart reporting tool for quickly creating powerful, stunning dashboards from multiple Google data sources.
It’s a great option for small/medium businesses already using Google tools, who want to build bespoke dashboards for that 40,000ft view of their business.
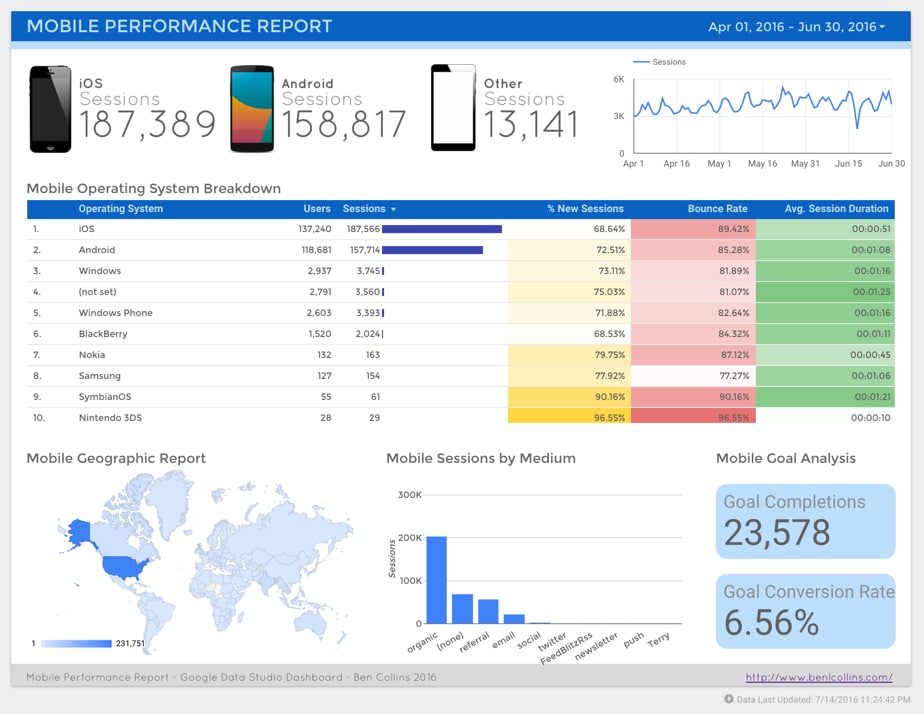
Here are two example reports for a mid-size website (~500k pageviews a month).
Firstly, a mobile performance dashboard:
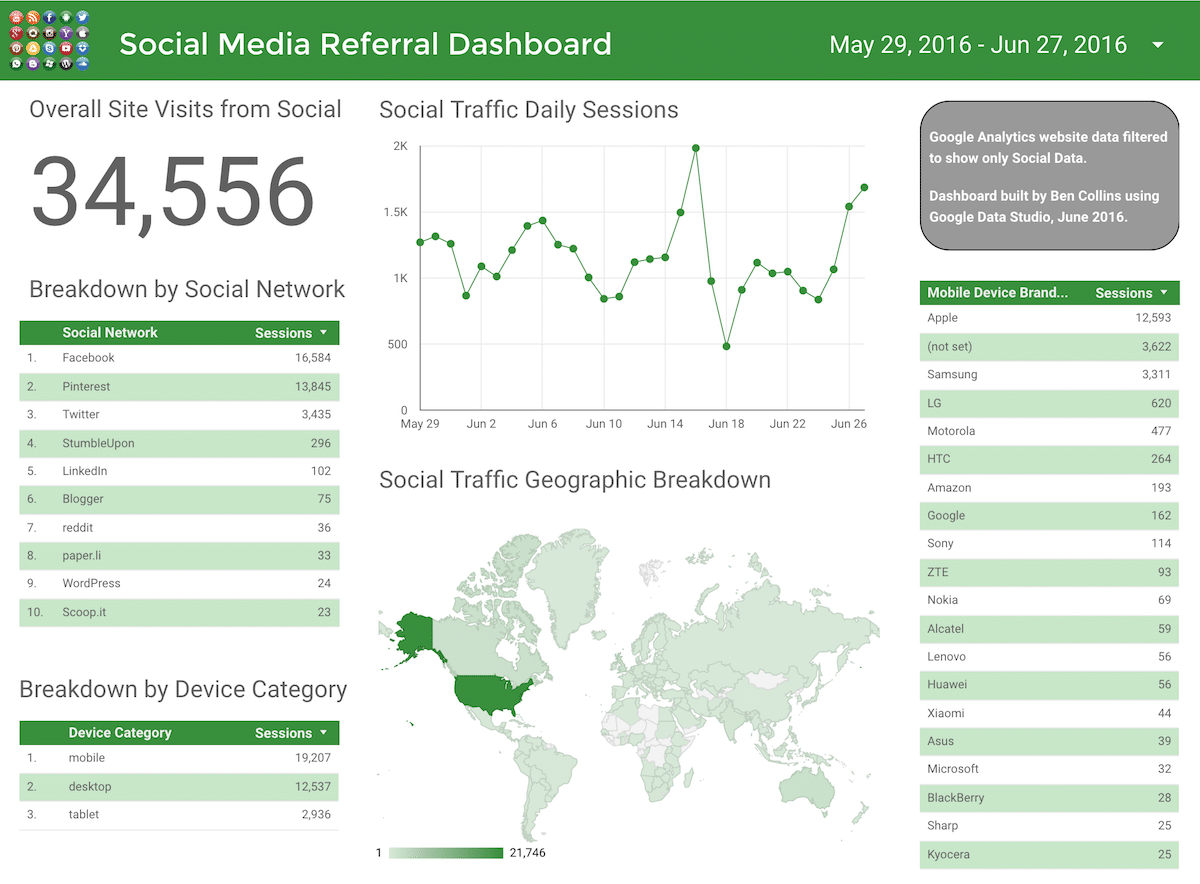
And second, a social media referral dashboard:
It’s only in beta version at the moment and new features and customization options get added pretty rapidly, so it will be interesting to see where Google take this product.
I wrote an introduction to the tool earlier this year, so that’s a good place to start if you want to find out more about it.
In this post I’m going to dive a little deeper into the tool and look at 6 techniques to master for creating dashboard reports using this tool:
Pages allow you to display multiple dashboard reports in a single Data Studio report. They’re useful and simple to implement in Data Studio.
You might use pages to drill-down in your data, starting with an overall summary sheet and then going into more specific details in subsequent sheets.
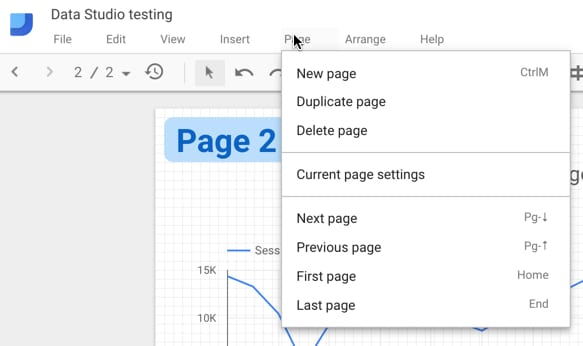
There are two menus for workings with pages, one in the main toolbar:
and one in the page control widget in top-left corner of your dashboard:
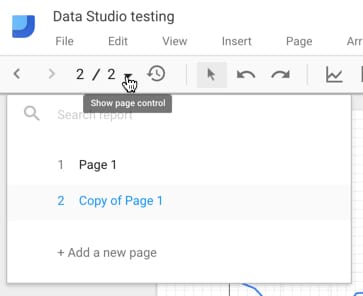
The toolbar menu is more extensive but both allow you to navigate through your pages and add new ones. The main toolbar menu allows you to duplicate pages, a handy feature if you set the first page up with your report styles, which can then easily be replicated.
The “Current page settings” option allows you to specify the data source (see point 2 below) for the page and control the background color scheme:
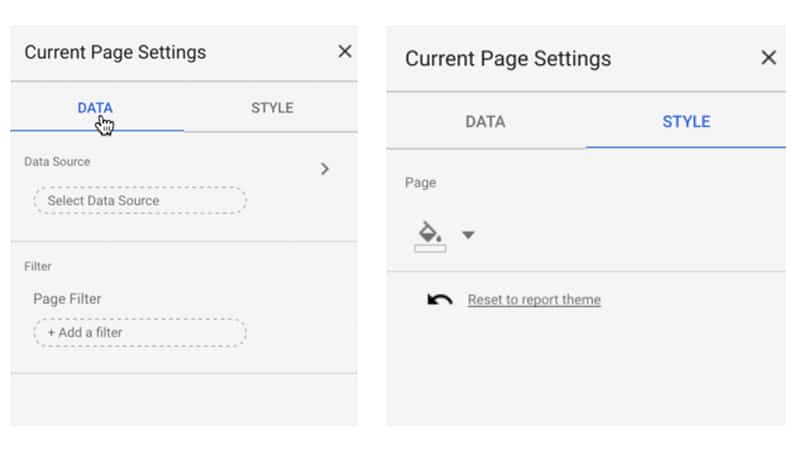
You can specify data sources at a page-level, rather than individually for each chart (although that’s perfectly acceptable too). The advantage of this page-level approach is that you can apply filters which will then be implemented across all your charts in that page.
For exmaple, in this GIF, I add my web data source and then restrict it to only data for the “iPhone” by creating a filter on the Mobile Device Model dimension:
If you use page-level filters, but then find yourself wanting to add a chart of KPI scorecard on unfiltered data, then you can toggle the “Inherit Filters” option at the bottom of the current chart options in the sidebar. This will remove the page-level filter from that specific chart only. The following GIF shows this toggle:
This is exactly the same page-level filter I applied when creating the mobile performance dashboard:
The Date Range filter is found on the top right position of the main toolbar:
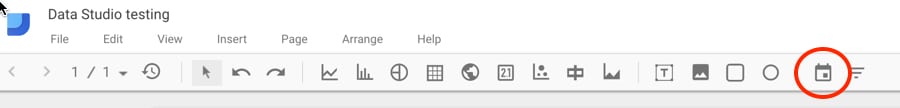
and the Date Range filter is the first of those two icons:
The Date Range filter is added by selecting that icon and dragging out a shape on your report where you want the date filter to go. By default the filter will be applied to all the charts, tables and scorecards on your page.
What if you don’t want that behavior? Well, you can restrict a date filter to only work with a single chart, or only specific, selected charts.
By grouping chart elements together with the Date Range filter, by highlighting them all at the same time, the filter will only be applied to those grouped elements. You group elements by selecting them all, then right clicking and selecting “Group”, or going to the Arrange menu and selecting “Group”, or by pressing Command + G, ⌘G .
The following GIF shows this process:
Before grouping the top elements, the date filter is applied to both charts. However, after grouping the top chart and the date filter, it is only then applied to that top chart. The bottom chart remains unchanged even if the filter changes.
The Filter Control option is the final icon of the main toolbar , the second of the two icons highlighted here:
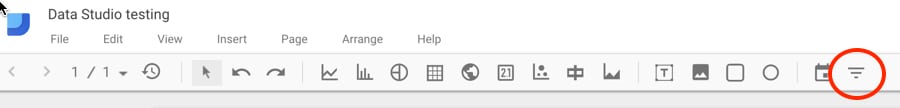
A Filter Control is a control for the user to narrow down the data to be displayed in the charts in the report. In the example below, I’ll show you how to add a Filter Control for device category, so that a user can select from Desktop, Tablet and/or Mobile data in the report.
Filter Controls are added in the same way as a Date Filter, by selecting the icon and then dragging out the required shape in your report.
There are “Data” and “Style” menu options added to the sidebar, as follows:
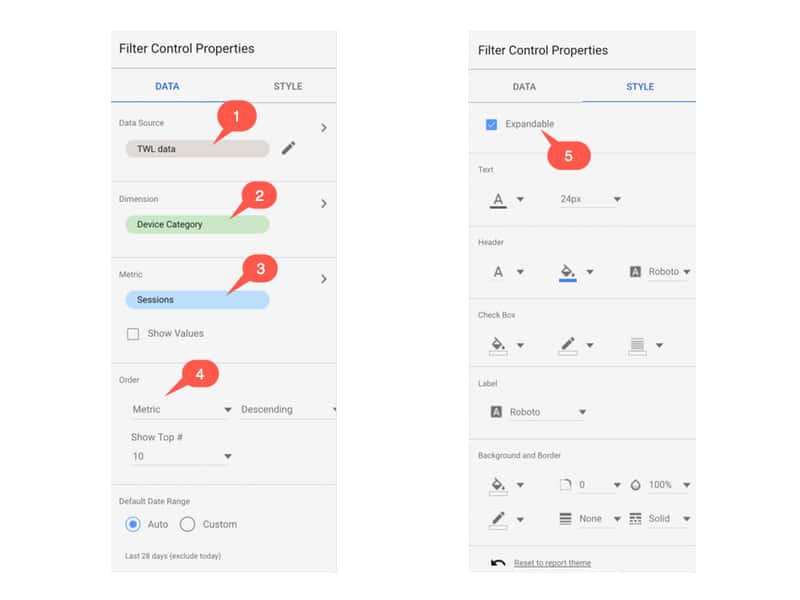
I’ve added the red numbers to highlight some of the specific features, firstly in the Data menu:
1. The Data Source – you can edit this if required, but it should default to the same as your page setting, which is most likely what you want.
2. The Dimension of your Control Filter, i.e. the dimension that is presented to the user as a choice and will narrow down the data showing in your charts and reports. In this example, I’ve chosen “Device Category”, which will allow a user to select from Desktop, Tablet and/or Mobile data in the report.
3. The Metric to be displayed. IMHO, not something I really want to see in my filter, so I’ve unchecked this item.
4. The sort order and number of options to be displayed. In this case, the options in my filter control will be sorted from highest to lowest, by number of sessions. So desktop comes at the top because that had the highest number of sessions.
In the Styles menu:
5. The checkbox to make the Control Filter expandable or not. In general, you’ll probably want to set this to be expandable unless you only have a very small number of options in the the control.
The remaining options in the Style menu are formatting for things like borders and backgrounds, so feel free to explore.
Like the Date Range filter, the Control Filter is applied to all your chart elements in a page based off the same data source, so if you want to apply to only selected elements then you’ll need to group them (see above).
For reports with multiple pages, any element in your report can be set to be Report-level or Page-level. Report-level elements are duplicated across all pages of your report, in the same position on each page. So this could be used for headers and footers, or perhaps an important KPI scorecard that you want shown on each page.
To access this option, right-click the element you want to duplicate across pages and select the last option “Make report-level”.
In the following GIF, the bullet chart is duplicated across all 3 pages:
Note: Making a chart element report-level also removes it from being governed by any filters you have on that page.
Finally, the most technical tip of the 6. It’s possible to define new data fields to use in your charts and reports.
What do I mean by this?
You can add new fields to your dataset, which you create by a custom calculation with existing data fields.
I’ll show you two examples, one simple example and one KPI that’s a little more useful.
First up, creating a calculated field to show the Medium dimension in uppercase, rather than the mix of lowercase and proper format of the default. This is done by applying a basic formula to the Medium dimension.
This is what the table looks like with the standard Medium dimension:
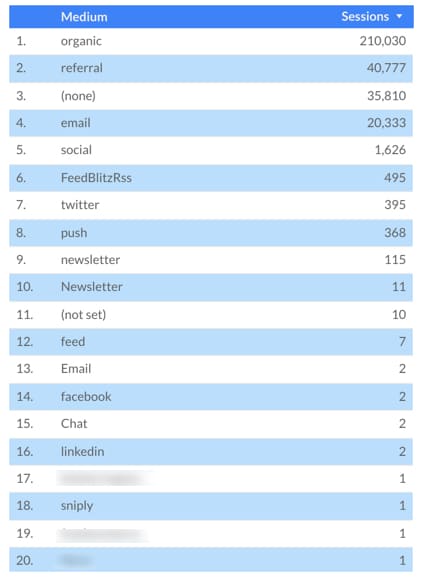
See how the different categories in the Medium column are showing some with capitals, some without. It’s messy, so let’s fix that.
Under data source in page settings, click the edit icon to the right of the data source:
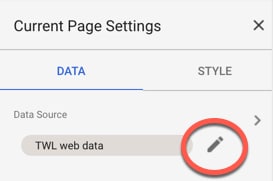
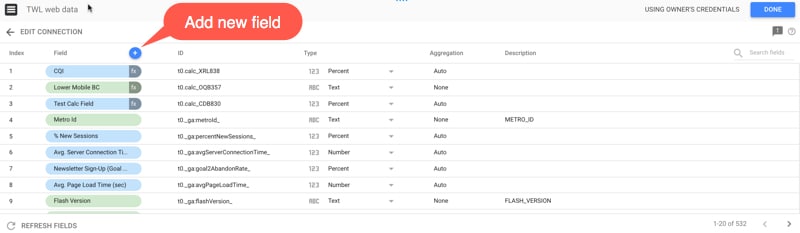
This opens the data pane, showing all of the current fields in our dataset.
It’s here that we can add a new calculated field, which will then be available to use in our charts. Click the small blue plus above the current list of fields to add a new one:
Give the calculated field a meaningful name so you’ll be able to find it easily later on. In this example, I’m leaving the ID field alone. I enter a formula into the Formula input box:
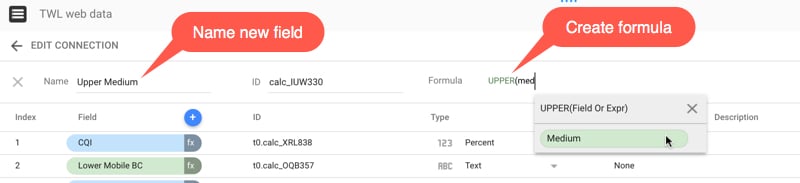
The formula is: UPPER(Medium)
![]()
Click “Create Field” on the right side and Google will add this new calculated field to the long list of fields in the dataset:
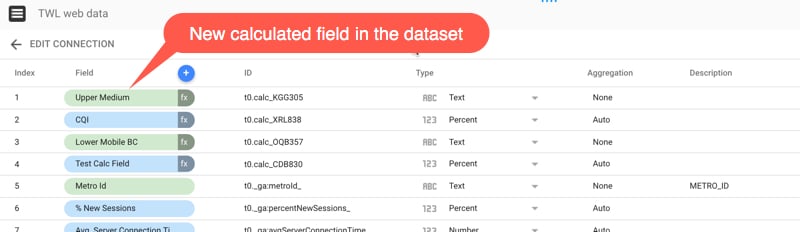
Note the little fx next to the name of your calculated field, to show that, well, it’s a calculate field, based on a formula.
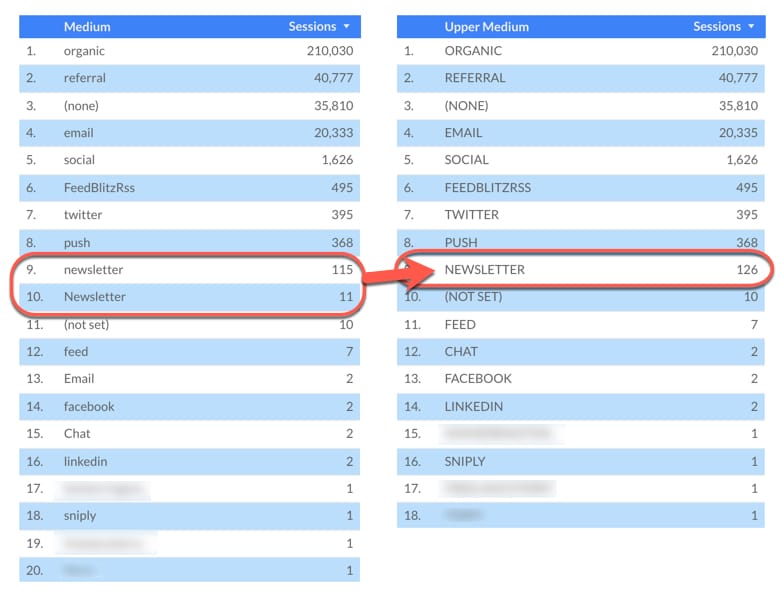
Now this field will be available for use in your charts. Create a new version of the original table, but replace Medium with Upper Medium (the new calculated field). The new table looks like this:
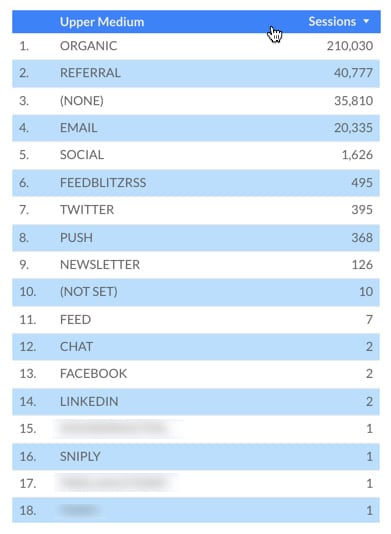
Looking much more consistent right? Whilst this might not be preferable, this example illustrates a basic calculated field.
Notice anything different? There are fewer entries, because previous differences, e.g. “newsletter” and “Newsletter” in our original, have now been aggregated together since they’re now identical, e.g. “NEWSLETTER”.
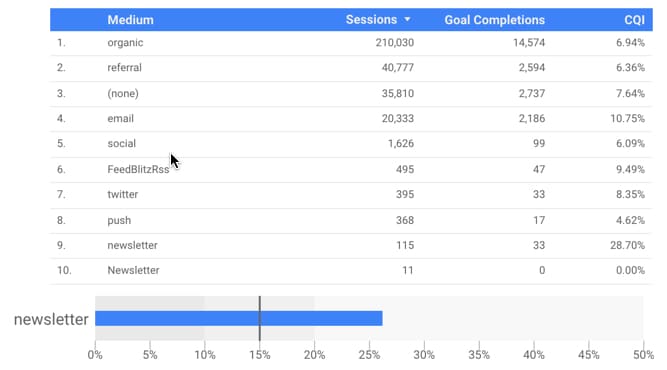
For another example of a calculated field, let’s create a useful KPI that we can display in our dashboard. I want to understand the quality of the traffic coming from each source, in terms of what percentage completes a designated “goal” (i.e. performs some action that we want the user to do, e.g. make a purchase, or sign-up for an email list).
So I want to create a new calculated field that shows goal completions divided by number of sessions and shows that as a percentage.
Following the steps above, with the following formula, gives:
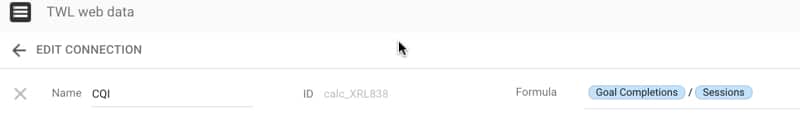
After clicking Create, this new metric “CQI” is added to our field list in the dataset:
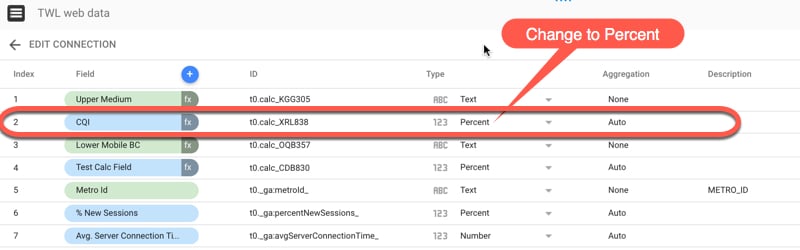
Note how I changed the “Type” to be “Percent”, rather than leaving as a decimal number. Now it’s ready to use in our reports:
Read more about calculated fields in the official Google docs.
In September 2017, Google launched native data connectors for Data Studio, so you can bring almost any data into your Data Studio reports directly.
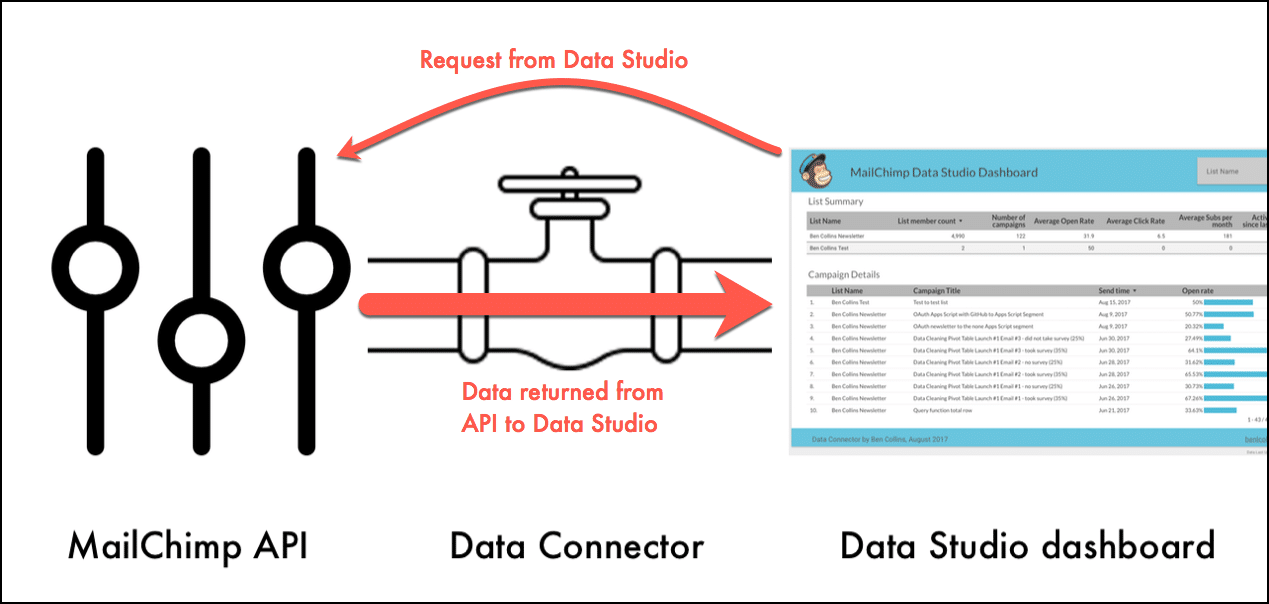
Read more about what they are, how to use them and how to build your own with Apps Script, in this in-depth post.
Hi Joni, I’m using LiceCap to capture the GIFs http://www.cockos.com/licecap/ I also use Snagit for screen captures, and this can also capture GIFs: https://www.techsmith.com/snagit.html Thanks,
Ben
Hi – Some great tips and advice there. I’ve written something on how to get around some of the restrictions of the free version of DS… http://www.wodanalysis.com/blog/2016/09/06/tips-using-free-version-googles-data-studio/
Ben says:Thanks for sharing your resource, somehow missed this back in September. Some great tips there. I’ve added to the page.
javi says:thanks for the info, we have much road to walk with this tool in your example of medium how could you show percentages instead of number?? t.i.a.
Ben says: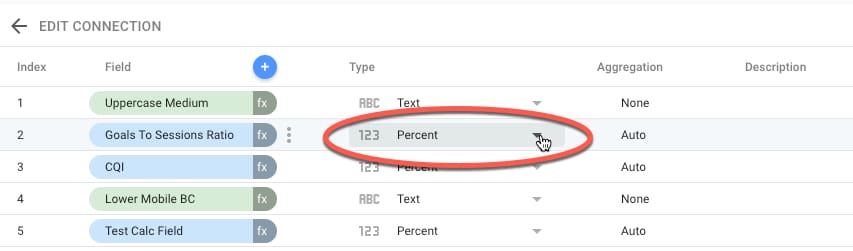
You can change the presentation mode in the data source, like so:
Also Ben says:Hey Ben, Great post. Re: changing data from number to percent. Do you know if there is a way to get rid of the digits after the decimal? Thanks, Ben
Ben says:Hey Ben, Argh! I can’t find a fix for this either. Seems like it should be really simple, right? But whenever you set a metric to display as PERCENT, you get the decimal places. Taking “Bounce Rate” as an example metric, here are some options with calculated fields: ROUND(Bounce Rate, 2) and set as PERCENT –> still has two 00 after the decimal place however ROUND(Bounce Rate, 2) * 100 and set as NUMBER –> removes the decimal places but you lose the % sign You could try posting the same question to the Data Studio Google+ community: https://plus.google.com/u/0/communities/117758923435762604552 Cheers,
Ben
Right? What a piece of crap! Just kidding. It’s (of course) still a super cool platform. I will head to the message boards! Thanks for offering your thoughts. Ben
Ben says:Hey Ben, Quick update on this: you can change the decimal places in a Scorecard under the Style options. Not available for the Tables though. See the comments below for a screenshot…
Lynn says:I believe you can edit the decimal points, but in the style tab rather than in the data sheet itself. Can’t post a screenshot, but it’s under Style > Primary Metrics > Decimal Precision. Choose how many decimal points you want to go from the dropdown (or choose zero) and tada!
Ben says: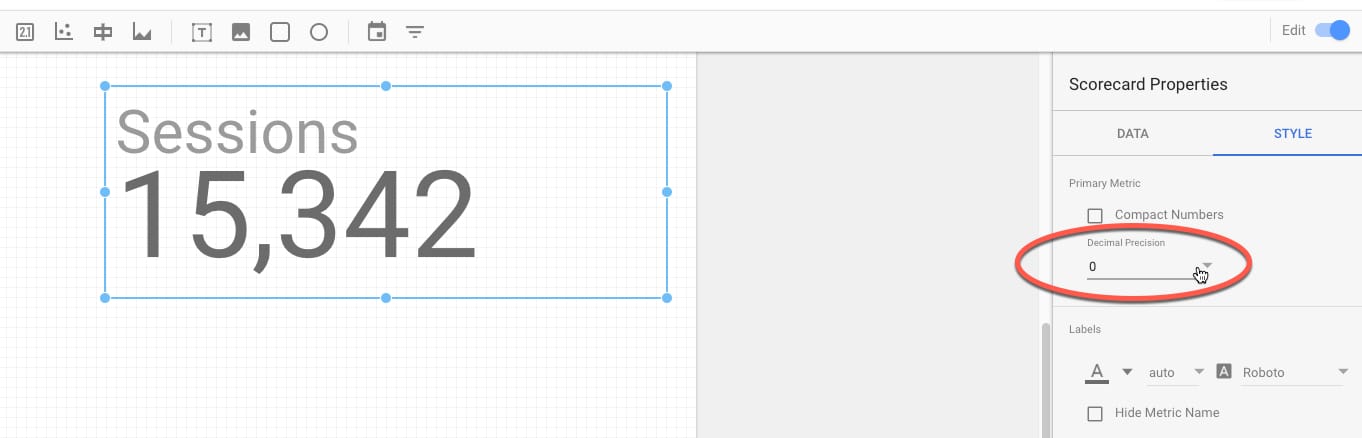
Hi Lynn, thanks for commenting and sharing this! For Scorecards, you’re right, you can change the decimal places in the Style tab. However, if you’re working with a Table, then this option isn’t available and you’re still stuck with your decimal places. Here’s that screenshot of editing decimal places on the Scorecard:
Jeff says:Hi Ben, Really enjoyed your post here, so thanks! Do you by chance know how to add two GA properties together in one graph? For example, let’s say you had two separate domains (one US and one Canada) and wanted to add their sessions together for a global view. Appreciate any direction you have on this,
Jeff
Hey Jeff, You won’t be able to get two GA properties in the same chart directly in Data Studio (you can however, have two separate GA properties on two adjacent charts). If you want them on the same chart to compare than you’ll need to use a Google Sheet as an intermediary step. Use the GA Add-on to import data from the two different properties, then combine the data into a single table in Google Sheets and then use this Sheet table as your data source in Data Studio. Hope that helps! Cheers,
Ben
Hi Jeff Thanks for the great insights. I’m slowing getting use to the Data Studio environment and these tips will assist greatly. A quick question, i’m trying to import AdWords quality score metrics for campaign keywords but I can’t seem to find this from the connected data source. I thought this would be part of the AdWords metrics when a connection is made? Any help on this would be great!
Adam
Apologies I meant to say ‘Hi Ben’ and not ‘Hi Jeff’. I accidentally read the previous poster and used that name instead!
Ben says:Ha, no worries Bob 😉 Hmm, I’m not familiar with AdWords metrics so can’t offer any advice here. If it’s available directly in AdWords then I would have expected it to be available in Data Studio… I’d suggest trying the help forums here and here. (Looks like you beat me to it…maybe? https://www.en.advertisercommunity.com/t5/Data-Studio/Data-Studio-Connecting-To-Adword-Quality-Score-Metric/td-p/900377)
Adam Orchard says:Hi Ben Thanks for the response and links, they are really useful. I think I’ve found a solution using an AdWords script to pull the data out and sync to a Google Sheet. The forum link you posted is a thread that I started 🙂 and the responses so far have also been really useful!
Ben says: Shariq Moosa says:Hey Ben, Great post – Its been a month now I am working with data studio and it is one of the best tools for visualization, I am struggling with creating a calculated field for Sessions (GA Property A) + Sessions (GA Property B), the end result to be the sum of android and iOS GA properties to show as one number, Is it possible without using Google sheets? Thank you
Ben says:Hey Shariq, Unfortunately, I don’t think this is possible direct in Data Studio, so you’ll have to use Google Sheets. You could ask or see if there’s anything in this forum, probably has the most relevant data studio info: https://www.en.advertisercommunity.com/t5/Data-Studio/bd-p/Data-Studio# Thanks,
Ben
You should be able to blend the data, and then when on the blend data tab you change the names of the metrics (for example Sessions1 and Sessions2). Then you can create a calculated field of Sessions1 + Sessions2
Bruno Gavino says:Great article with great insights. In this line we’ve developed a Free Google Data Studio Template for Ecommerce. You just have to connect your own Google Data sources and start using it here: https://goo.gl/O04k38. What do you think?
Kunal Patni says:Great Article!, I need some help here.
I want to add something like we do with where clause in SQL like query language i.e. I want create bar charts and table here by monthly rate(I’ll calculate this with Daily rate field) only for staffed employees. So, how can we create calculated formula for such use cases. Let’s say, I have following columns and values
Status DailyRate Effective_StartDate
Staffed $10 20170315
Pending $10
Staffed $10 20170225
Hi Ben, How have you done the conditional formatting in your tables?
I can’t see an option to format this at all, is it an option that has been made obsolete currently? Regards,
George
I have the exact same question. How did you do conditional formatting? Maybe in the paid version? Definitely not available in the free version
Ben says:In the Style section for the table, for each column you can display the numbers as a heatmap, which is how I’ve achieved this effect.
Marie says:Is there a way in google data studio to show 3 data points for one day in a time series chart? I’ve looked all around, and I can’t seem to find a way to track the numbers for 3 shifts per day for each metric to show a trend over time. I was hoping to use data studio since I need to take 3 daily numbers for about 15 different data points which are entered into google sheets by multiple people and work it into weekly, monthly, and quarterly reports which show trends
Martin says:Hello Ben,
Thanks a lot for your video there are a lot of tips and best practices! I wanted to know if it is possible to make calculus within Data studio according to a filter ?
For example, I would have 1 filter for a Date and a second filter for an other Date and according to my inputs, the scorecard would display the ratio of the numbers related to these two dates. This could allows me to be very flexible with the user. Indeed, the user would have de capacity to compare any date he wants. Thanks for your help,
Jean
Very useful, Ben! But, I’m trying to filtering/categorize with a custom field with an example like this: …
WHEN REGEXP_MATCH(Campaign, “BLU”) THEN “Colour Blue”
WHEN REGEXP_MATCH(Campaign, “GRE”) THEN “Colour Green”
WHEN REGEXP_MATCH(Campaign, “CAR”) THEN “Product Car”
WHEN REGEXP_MATCH(Campaign, “MOT”) THEN “Product Motorbike”
… And works fine for campaigns with only one “tag”, like MOT or GRE, for example. I have also campaigns with more than one tag, for example CAR+GRE, and the REGEXP only returns the first true condition, in this case, CAR. But I’m not able to categorize both, CAR and GRE. Do you know how to achieve this? Many thanks!
Great guide Ben! Do you know if there is any way to have conditional formatting as a series of colour rather than a heat map? I.e. like =IF() in Excel so I can change it to either red or green? Cheers
Graham
Hi Ben, How do you automatically change the colour of the yellow, red and green with session, bouncerate and average session duration? I can only find how you change the background colour, but not dynamically? Cheers, Freek
Thomas Thompson says:Nice article. I’m looking for a way to custom format my data so that the zeros are not dropped off my product numbers. I use TEXT function in excel for this but I can’t figure out how to do it in Google Data Studio. Do you have any suggestions on how to do it?
Angel says:Hi Ben, As usual, this is an amazing article. Ben, I would like to create a button or an image that can reset all filters on my report. There is a refresh button at the top but when I embed the report in a google site the refresh button and other controls disappear. Someone on the help forum suggested that I could create a text box with a hyperlink to the report but this is a bit hit and miss. I wonder if you have any ideas, please?
Jack says: Hi Angel, I’m having the same issue, did you even find a solution to this? Thanks! Vicky Tosh-Morelli says:Great article, your section on calculated fields help lead me to the correct path for grouping languages which show up as language+country code like en-gb. I created a calculated field using this formula SUBSTR(Language,1,2) to grab the first two characters.