In this module, we will focus on how quantitative research collects and analyzes data, as well as methods for obtaining sample population.
Objectives:
Once researchers have collected their data (we will talk about data collection later in this module), they need methods to organize the data before they even start to think about statistical analyses. Statistical operations depend on a variable’s level of measurement. Think about this similarly to shuffling all of your bills in some type of organization before you pay them. With levels of measurement, we are precisely recording variables in a method to help organize them.
There are four levels of measurement:
Nominal: The data can only be categorized
Ordinal: The data can be categorized and ranked
Interval: The data can be categorized, ranked, and evenly spaced
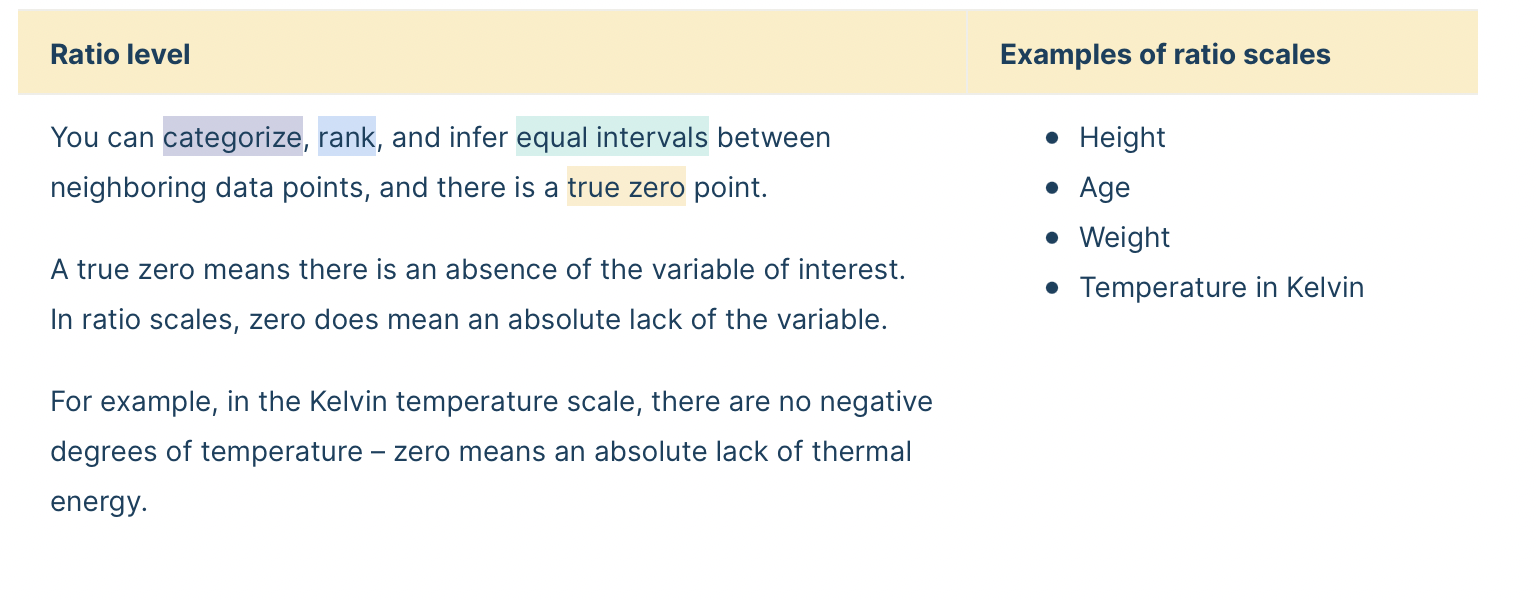
Ratio: The data can be categorized, ranked, even spaced, and has a natural zero
Going from lowest to highest, the 4 levels of measurement are cumulative. This means that they each take on the properties of lower levels and add new properties.


Why are levels of measurement important?
The level at which a researcher measures a variable determines how he/she can analyze the data.
The different levels limit which descriptive statistics can be used to get an overall summary of the data, and which type of inferential statistics can be performed on the data to support or refute the hypothesis.
In many cases, the variables can be measured at different levels, so the researcher has to choose the level of measurement they will use before data collection begins.
![]()
Hot Tip! How can you tell a variable’s measurement level?
Reliability measures the ability of a measure to consistently measure the same way. Validity measures what it is supposed to measure. Do we have the need for both in research? Yes! If a variable is measured inaccurately, the data is useless. Let’s talk about why.
For example, let’s set out to measure blood glucose for our study. The validity is how well the measure can determine the blood glucose. If we used a blood pressure cuff to measure blood glucose, this would not be a valid measure. If we used a blood glucose meter, it would be a more valid measure. It does not stop there, however. What about the meter itself? Has it been calibrated? Are the correct sticks for the meter available? Are they expired? Does the meter have fresh batteries? Are the patient’s hands clean?
Reliability wants to know: Is the blood glucose meter measuring the same way, every time?
Validity is asking, “Does the meter measure what it is supposed to measure?” Construct validity: Does the test measure the concept that it’s intended to measure? Content validity: Is the test fully representative of what it aims to measure? Face validity: Does the content of the test appear to be suitable to its aims?
Measures the ability of a measure to
consistently
measure the same way
This is important for consistent measures of a construct.
For example, when measuring a patient’s blood pressure, the blood pressure cuff should consistently measure in the same way. So, when doing every 15-minute vital signs after surgery, the blood pressure cuff should measure consistently every 15 minutes.
Measures the concept it is
supposed
to measure
This is important to be able to measure the intended construct.
For example, a measure of critical thinking is an accurate measure of critical thinking and not expert practice.
Another example: a measure of stress level should measure stress level, not pain level.
In quantitative research, a population is the entire group that the researcher wants to draw conclusions about.
A sample is the specific group that the researcher will actually collect data from. A sample is always a much smaller group of people than the total size of the population. For example, if we wanted to investigate heart failure, there would be no possible way to measure every single human with heart failure. Therefore, researchers will attempt to select a sample of that large population which would most likely reflect (AKA: be a representative sample) the larger population of those with heart failure. Remember, in quantitative research, the results should be generalizable to the population studied.
A researcher will specify population characteristics through eligibility criteria. This means that they consider which characteristics to include ( inclusion criteria ) and which characteristics to exclude ( exclusion criteria ).
For example, if we were studying chemotherapy in breast cancer subjects, we might specify:
Sampling Designs:
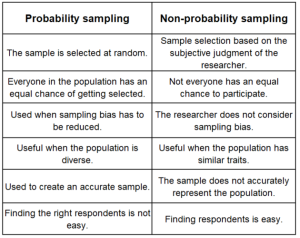
There are two broad classes of sampling in quantitative research: Probability and nonprobability sampling.
Probability sampling : As the name implies, probability sampling means that each eligible individual has a random chance (same probability) of being selected to participate in the study.
There are three types of probability sampling:
Simple random sampling: Every eligible participant is randomly selected (e.g. drawing from a hat).
Stratified random sampling : Eligible population is first divided into two or more strata (categories) from which randomization occurs (e.g. pollution levels selected from restaurants, bars with ordinances of state laws, and bars with no ordinances).
Systematic sampling : Involves the selection of every __ th eligible participant from a list (e.g. every 9 th person).
Nonprobability sampling : In nonprobability sampling, eligible participants are selected using a subjective (non-random) method.
There are four types of nonprobability sampling:
Convenience sampling : Participants are selected for inclusion in the sample because they are the easiest for the researcher to access. This can be due to geographical proximity, availability at a given time, or willingness to participate in the research.
Quota sampling : Participants are from a very tailored sample that’s in proportion to some characteristic or trait of a population. For example, the researcher could divide a population by the state they live in, income or education level, or sex. The population is divided into groups (also called strata) and samples are taken from each group to meet a quota.
Consecutive sampling : A sampling technique in which every subject meeting the criteria of inclusion is selected until the required sample size is achieved. Consecutive sampling is defined as a nonprobability technique where samples are picked at the ease of a researcher more like convenience sampling, only with a slight variation. Here, the researcher selects a sample or group of people, conducts research over a period, collects results, and then moves on to another sample.
Purposive sampling : A group of non-probability sampling techniques in which units are selected because they have characteristics that the researcher needs in their sample. In other words, units are selected “on purpose” in purposive sampling.

There are various methods that researchers use to collect data for their studies. For nurse researchers, existing records are an important data source. Researchers need to decide if they will collect new data or use existing data. There is also a wealth of clinical data that can be used for non-research purposed to help answer clinical questions.
Let’s look at some general data collection methods and data sources in quantitative research.
Existing data could include medical records, school records, corporate diaries, letters, meeting minutes, and photographs. These are easy to obtain do not require participation from those being studied.
Collecting new data:
Let’s go over a few methods in which researcher can collect new data. These usually requires participation from those being studied.
Self-reports can be obtained via interviews or questionnaires . Closed-ended questions can be asked (“Within the past 6 months, were you ever a member of a fitness gym?” Yes/No) or open-ended questions such as “Why did you decide to join a fitness gym?” Important to remember (this sometimes throws students off) is that conducting interviews and questionnaires does not mean it is qualitative in nature! Do not let that throw you off in assessing whether a published article is quantitative or qualitative. The nature of the questions, however, may help to determine the type of research (quantitative or qualitative), as qualitative questions deal with ascertaining a very organic collection of people’s experiences in open-ended questions.
Advantages of questionnaires (compared to interviews):
Advances of interviews (compared to questionnaires):
Psychosocial scales are often utilized within questionnaires or interviews. These can help to obtain attitudes, perceptions, and psychological traits.
Likert Scales:
Visual Analog Scale:
Observational Methods include the observation method of data collection involves seeing people in a certain setting or place at a specific time and day. Essentially, researchers study the behavior of the individuals or surroundings in which they are analyzing. This can be controlled, spontaneous, or participant-based research .
When a researcher utilizes a defined procedure for observing individuals or the environment, this is known as structured observation. When individuals are observed in their natural environment, this is known as naturalistic observation. In participant observation, the researcher immerses himself or herself in the environment and becomes a member of the group being observed.
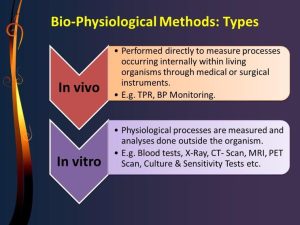
Biophysiologic Measures are defined as ‘those physiological and physical variables that require specialized technical instruments and equipment for their measurement’. Biophysiological measures are the most common instruments for collecting data in medical science studies. To collect valid and reliable data, it is critical to apply these measures appropriately.

Let’s watch a video about Sampling and Data Collection that I made a couple of years ago.

![]()
Critical Appraisal! Quantitative Sampling and Data Collection:
Bhandari, P. (2022). Levels of Measurement | Nominal, Ordinal, Interval and Ratio. Scribbr. https://www.scribbr.com/statistics/levels-of-measurement/
Polit, D. & Beck, C. (2021). Lippincott CoursePoint Enhanced for Polit’s Essentials of Nursing Research (10th ed.). Wolters Kluwer Health.